AI is “artificial intelligence” not “accidental intelligence”. Every organization must embrace AI as a fundamental component in each aspect of their business but it must be done correctly from the start. Before even thinking about tools you must start with a modern and adaptive governance practice. AI only works if you trust the data feeding the engine and allows for effective decision intelligence.
You must then have a strategy in place to embed AI into your applications and processes. Making AI part of the design of new applications or modernization of existing ones allows for the analysis of data much quicker and seamless for the end user. Some key areas to focus on are:
Enhanced Customer Experience
Process/Task Automation
IT Operations
Self Integrating Apps
Predictive Maintenance
Behavioral Analytics
Security & Risk Management
Virtual Assistants
Fraud Detection/Prevention
Prolifics has a core set of capabilities and offerings that will help at every step of your data and analytics journey. We start with a set of workshops designed to frame out the business needs and to chart your journey to success. Additionally, we have frameworks which set a critical foundation in place which is necessary to achieve successful business results along the way.
Matt Garst leads sales for Digital Automation and Cloud Solutions for Prolifics. Matt has over 20 years of experience in sales in the information technology industry. Most recently, he was responsible for the IBM software business within the US Army and Missile Defense Agency. Prior to his role at IBM, he was the Vice President of Worldwide Sales for Enterprise Information Management, where he led a sales team focused on software and professional services. Matt began his career as a soldier in the U.S. Army where he served six years in the Infantry.
Do you have consumer data anywhere in your organization? Of course you do. Then this installment of Prolifics’ Geek Out series is crucial for you. Yep – it’s all about data privacy.
Data privacy is not slowing down or going away. More governments at all levels are proposing and adopting privacy regulations. You’re going to have to deal with it – the only question is when.
And dealing with it means technology – this is not a manual process you can throw a few employees at. You’ll need to find, itemize, tag, delete, update and otherwise manage consumer information wherever it exists in your company – quickly and efficiently. Fines and penalties await those who don’t.
The data experts from Prolifics and Data Sentinel are here to “geek out” on the new technologies behind data privacy and data governance. This tech will not only help you toward privacy compliance, but will lead to better decision-making, improved efficiencies, and increased revenue and growth.
After you watch the video, read more about Data Sentinel’s Sensitive Data Audit … and connect with us at solutions@prolifics.com to discover the data privacy solution that’s best for your business.
Prolifics’ Analytic Platform Optimization solution is unique to the industry and will show you how to better balance, and even maximize, the productivity of your existing servers. And we can guarantee it’s a lot less expensive than adding more servers.
The Budget Alarm Bells Go Off – Loud
It’s the first sign – you’re overbudget on your spending for servers. It could be the front-end or the back-end platforms, at this point it doesn’t seem to matter. You turn to your staff and ask:
“Why in the heck are we spending so much money on licenses? And now it looks like we’re going to have to get more servers and our licenses are going to go up even more? Why is this happening?”
The result is generally blank stares or mumbling about the need based on all the work being done. There may be a project assigned to look at the over-budget platform. But that won’t necessarily solve anything because it’s usually not a one-platform problem.
It’s a Platform Ecosystem Problem
Michael Gonzales, PhD (“Dr. G”) is Prolifics’ Chief Data Scientist and the force behind Analytic Platform Optimization.
“Clients ask us, ‘Why are we spending so much?’” says Dr. G. “And when we get in discussions with them, we make the case for the multiple platforms. Because you’re not going to solve your problem just looking at one of the platforms by itself. If you look at it in isolation, you’re not looking at the total picture. And at Prolifics, we look at the total picture. The problem is that the scale of the total picture is huge. So that’s why almost nobody does it. But we use data science so that we can simplify the whole process and come up with legitimate, actionable results that we can help you implement.”
The Total Picture is All About Balance
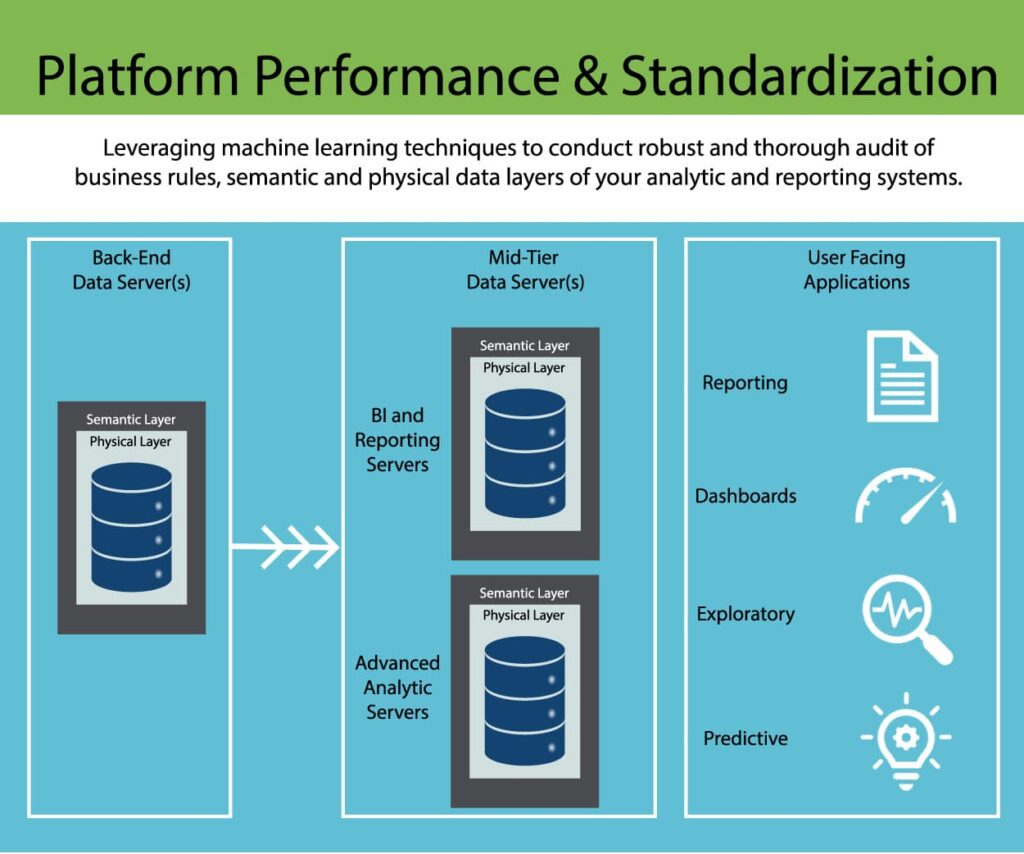
The real issue is that the front-end and back-end platforms are essentially out of balance – one is over-used and one is under-used.
Example:
A client had a mid-tier BusinessObjects server farm and Teradata for the back-end.
BusinessObjects developers pushed data requests back and forth using SQL, manipulating data on the front-end without knowing what Teradata could handle.
Teradata staff only monitored SQL requests and didn’t know about upstream manipulations.
“What happens or what’s totally missed, in most of these organizations, is a clear view of all the code that’s been written to move the data,” says Dr. G. “We take a global view, so we’re not interested in the network speeds or necessarily concerned about specific queries. What we’re concerned with is the global view – the balance of all the code being written. Where is the ‘heavy lifting’ being done, and where should it be done?”
How Does Prolifics’ Analytic Platform Optimization Work?
Dr. G explains:
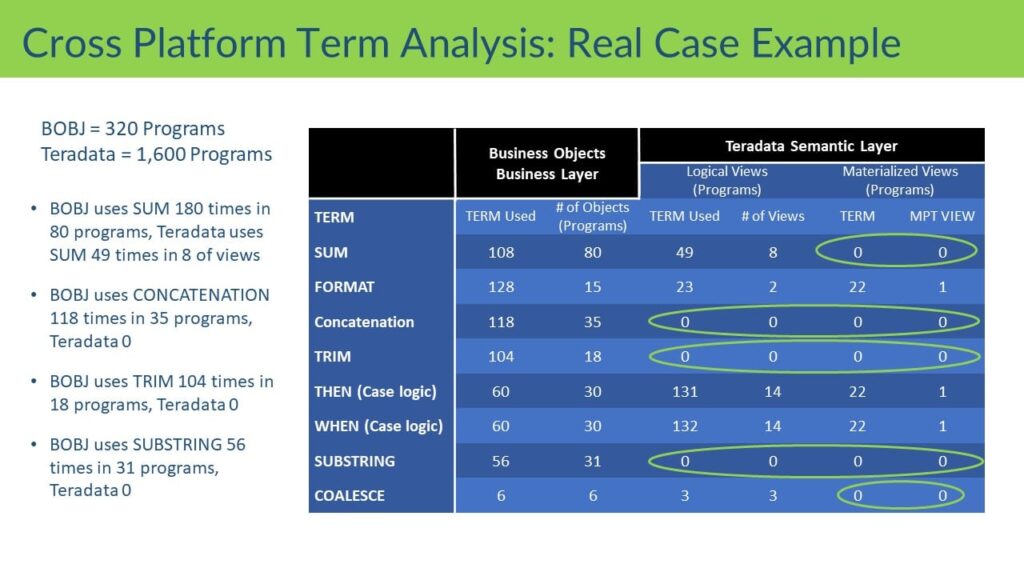
“You can’t read all the lines of code to see where the ‘heavy lifting’ is – it’s impossible because of sheer scale and knowledge needed for different platforms. Instead, our process works because it uses data science and text mining to consume thousands of programs and analyze the word usage in the language (SQL or any language). I’ve developed a dictionary for very specific words that I know characteristically are ‘resource pigs.’ These words demonstrate a lack of proper planning – they just consume a ton of resources on one platform versus the optimal use of both platforms.”
Key Benefits:
Identifies exact programs causing imbalance
Pinpoints under-utilized platforms
Optimizes server performance across the ecosystem
Then What?
Prolifics doesn’t just identify issues – we provide a complete optimization plan:
Agile sprint plans to fix the worst offenders first
Dedicated expert developers for implementation
Continuous monitoring and process closure
Put that pen down – don’t sign another server license until you talk to us.
We provide consulting, engineering, and managed services at any point you need them – giving you fast, complete solution delivery experiences that you will find nowhere else.
Whether it’s advising and strategy, design and implementation, or ongoing analysis and guidance, Prolifics will help you take charge of your digital future.
Digital + data + data science = vision to value, faster. That’s the message shared in this presentation hosted by DCO Canada and presented by Chief Data Scientist Michael Gonzales. The conversation starts with this quote from an article published through the Harvard Business Journal* – The worst mistake a company can make is to hire data scientists, give them access to data, and turn them loose expecting them to come up with something brilliant. – In fact, the role of a data science team is to bring business value, business impact. That can’t happen without business involvement. Dr. Gonzales shares valuable insight into marrying your digital and data to receive maximum results.
*Harvard Business Journal Publication – Are You Setting Up Your Data Scientists to Fail?
An Analytic Ecosystem Inventory (AEI) helps organizations document and quantify their current analytics landscape. It collects metrics about analytic applications, supporting technologies, and data sources — offering a clear view of how analytics is implemented and consumed across the business.
Unlike general assessments that capture opinions from analytic users, the AEI focuses on quantitative insights. It measures the technologies, applications, and user communities that shape your organization’s analytic maturity.
What the Analytic Ecosystem Inventory Includes
The AEI framework typically covers four major components:
Antecedents: Documentation related to analytics, corporate objectives, and standards.
Applications: Analytic applications, their user base, and life stage.
Technologies: Tools and platforms supporting analytic operations.
Data: Information about data sources, size, type, and frequency of use.
To ensure consistency, it’s best to use a structured instrument — such as a spreadsheet — for gathering data. This enables accurate, repeatable collection even when multiple teams are involved.
1.Understanding Antecedents
Antecedents are formal documents used to evaluate the maturity of analytics in an organization. For example, a business strategy that references analytics demonstrates that the enterprise recognizes data as a competitive advantage.
Below are key artifacts assessment teams should review when determining analytic maturity:
Business strategy documents referencing analytics (can be redacted if necessary)
Analytic strategy documentation
Organization charts for analytics and data governance teams
Analytic development and implementation standards
Example of a requirements document for the analytic environment
Example of a test plan for an implemented analytic application
Example of a Service Level Agreement (SLA) with user communities
Education curriculum or training offered by the analytics team
Course evaluation forms used post-training
Gathering these documents requires minimal resources. Teams can request documents during the kickoff session, follow up with examples via email, and confirm titles shared by internal stakeholders.
2.Technical, Data, and Application Examination
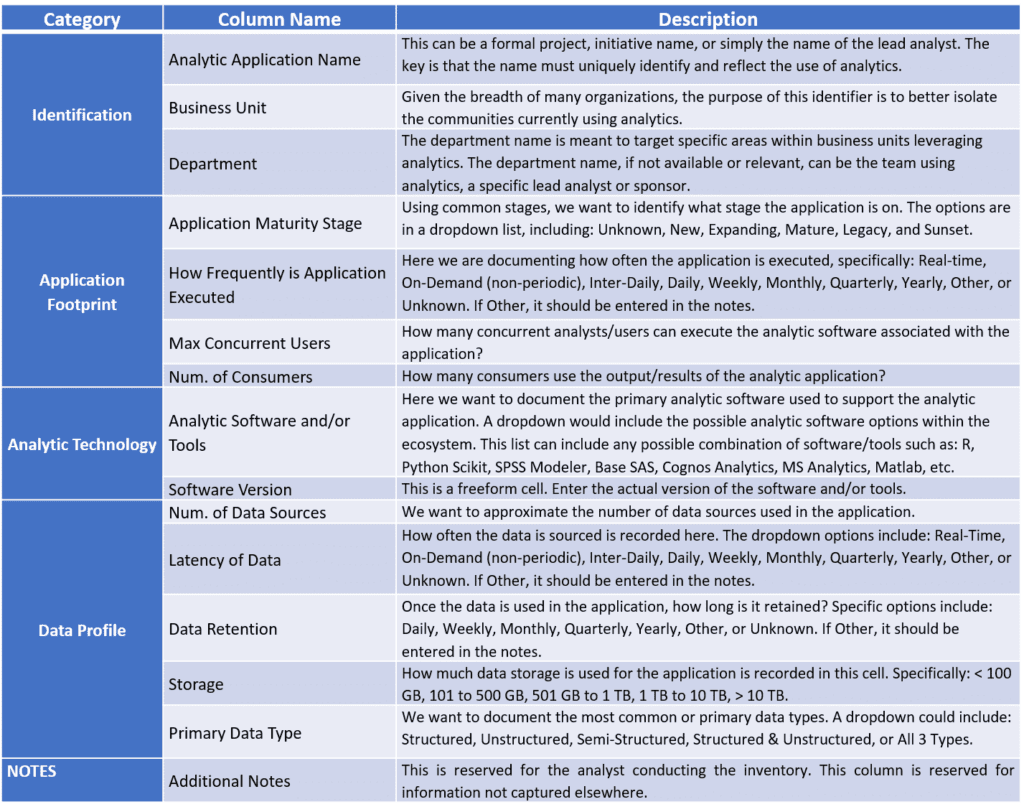
An Excel-based AEI spreadsheet helps structure and standardize information collection. It should include columns for:
Technology licenses
Data sources and size
Supported user communities
Applications built on each technology
Table 1: Architecture Inventory (not shown)
This format provides clarity when evaluating relationships among applications, technologies, and users.
3. Techniques for Analyzing the AEI
The AEI involves two primary areas of assessment:
Formal antecedent documentation
The inventory of analytic applications, supporting technology, and data
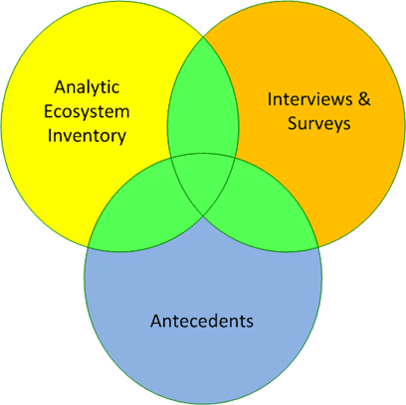
To gain accurate insights, teams should not analyze these areas in isolation. Instead, compare findings across information sources—such as surveys, interviews, and inventory data—to validate consistency.
For instance:
If SMEs mention specific analytics technology standards, those should appear in the technology inventory.
If SMEs claim there’s no formal training but the organization offers a structured curriculum, that discrepancy needs investigation.
Figure 1 – Overlapping Information Channels highlights how these data sources intersect.
4. Analyzing Antecedents
To evaluate antecedent documents effectively, teams can:
Review each document and provide observations.
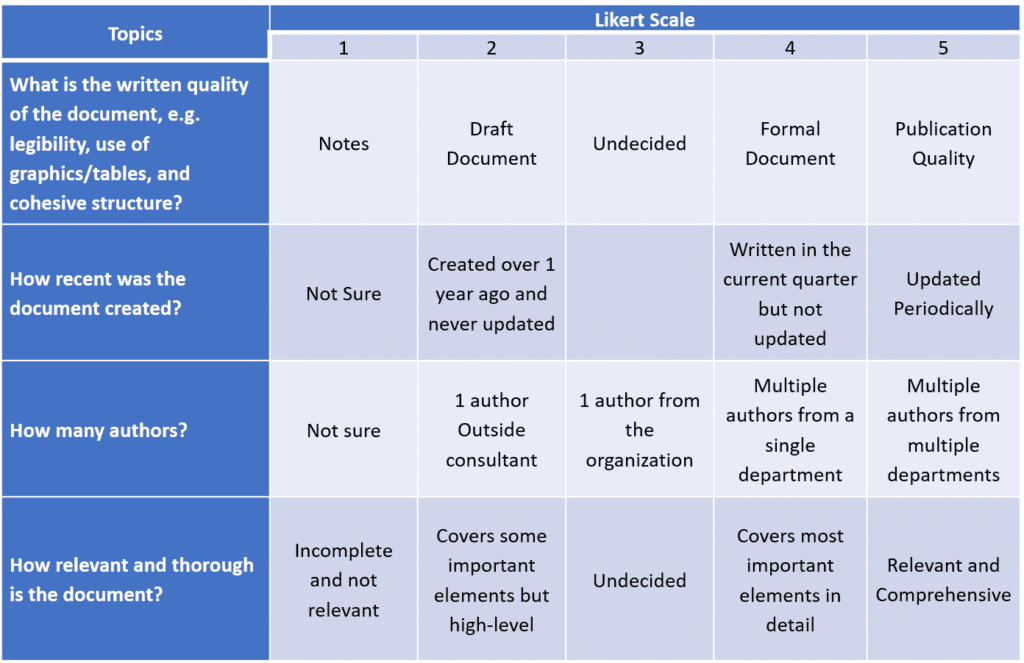
Use a Likert Scale to rate maturity factors.
This structured approach enhances repeatability and transparency, compared to subjective review methods. (Refer to Table 2 – Assessing Antecedents for sample evaluation criteria.)
Table 2 – Assessing Antecedents
5. Analyzing the Inventory
The AEI offers valuable insights based on quantitative patterns. Analysts can use these patterns to answer key questions such as:
Support for Standards – How consistent are the technologies supporting analytics? Are multiple versions in use?
Application Maturity – Are applications mostly new, expanding, mature, or legacy?
User Communities – Do these applications support broad user groups or niche teams?
Departmental Concentration – Are analytic applications centralized or spread across departments?
Data Latency – Is the data consumed in batches, real time, or on demand?
These findings help organizations identify gaps, improve efficiency, and enhance governance across their analytics landscape.
Conclusion
Conducting an Analytic Ecosystem Inventory provides organizations with a comprehensive snapshot of their analytic maturity. By documenting antecedents, technologies, applications, and data sources, teams can uncover improvement opportunities, align analytics with business goals, and support future scalability.
About the Author
Michael L. Gonzales, Ph.D., is an IT industry veteran with over 30 years of experience as a Chief Architect and Senior Solutions Strategist. He specializes in leveraging business analytics for competitive advantage in global enterprises.
His research and presentations have been featured at leading international conferences such as:
Decision Sciences Institute
Americas Conference on Information Systems
Hawaii International Conference on Systems Science
Dr. Gonzales holds a Ph.D. in Information and Decision Science from the University of Texas. He currently serves as Managing Partner at dss42, LLC, and Senior Data Scientist at Prolifics.
Companies that know how to leverage their analytic and IT resources gain a business analytic-enabled competitive advantage (Porter, 1980; Sambamurthy, 2000), which is the basis of our research. For the purpose of this guide, the term analytics represents a comprehensive view that encompasses the 5 analytic areas listed below and related topics.
The challenge, when creating an analytic-enabled business strategy, is to identify which activities to focus on. To that end, our research identifies factors of analytic-centric initiatives that significantly contribute to the overall maturity and success of a program (Gonzales, 2012). Building on this research, coupled with extensive practical application of maturity assessments for leading companies our Comprehensive Analytic Maturity Assessment (CAMA) creates an index that measures the analytic-enabled competitive maturity of an organization.
The Value of a Repeatable Analytic Maturity Assessment
While it’s important that companies invest in an unbiased measurement of their analytic maturity, it is only a fraction of the value. One key success factor is the ability to periodically conduct the same assessment to measure and monitor the progress of your analytic program(s). If you can demonstrate significant maturity increases, the results will support your argument for additional budget and resources.
Conducting the same assessment periodically means that you must retain the instruments used and methodology applied. Some assessment services will simply not comply.
Dr. Michael Gonzales, Chief Data Scientist with Prolifics, doesn’t recommend that you invest in any assessment that contains black-box processes. “Frankly, if you do not have an assessment that provides visibility to all aspects of how the maturity level is derived, then it’s not worth the price,” Gonzales explains. “Real value from these initiatives is derived when you can internalize the assessment instruments and processes to enable your organization to periodically conduct the assessment.”
The following video describes 4 of the instruments this author recommends.
Five Analytic Areas for CAMA
Data Science (DS) – an inter-disciplinary field to unify statistics, machine learning, deep learning, big data, and data analysis.
Machine Learning (ML) – the application of computer algorithms that improve automatically through experience. A sub-set of Artificial Intelligence.
Business Intelligence (BI) – techniques and technologies used for data analysis of business information including the provision of historical and current views of operations.
Big Data – a field focused on the analysis of data sets too large or complex to be dealt with by traditional data processing.
Spatial Analysis – the application of statistical analysis and related techniques to data with a geographical dimension.
More questions about your company can gain and maintain a competitive advantage using advanced analytics? Our experts are here to help.
You’ve heard the term process mining. But what is it really? And why should your business invest in more technology? This presentation answers those questions. It explores what makes process mining so valuable, and shows how it can help you save costs, improve efficiencies and increase revenue. Let’s start with this definition: Process Mining is an evidence-based solution designed to let DATA tell its TRUE story. What story does your data have to tell?
Embrace and leverage data science for innovative solutions. This presentation is designed to bring together business and data science members to achieve maximum outcomes.
Data and analytics are drivers for success in every industry – that’s a fact. And the amount of data consumers create and businesses consume is exploding at rates unfathomable just a decade ago. So how do you keep up? Better yet, how do you harness the power of your data to get ahead and stay ahead of your competition. Three legends in the data and analytics space share innovative ways analytics is shaping the next set of industry disruptors. Don’t miss the conversation in the Innovation Sandbox.